Fantasy Box Office League Draft Rating
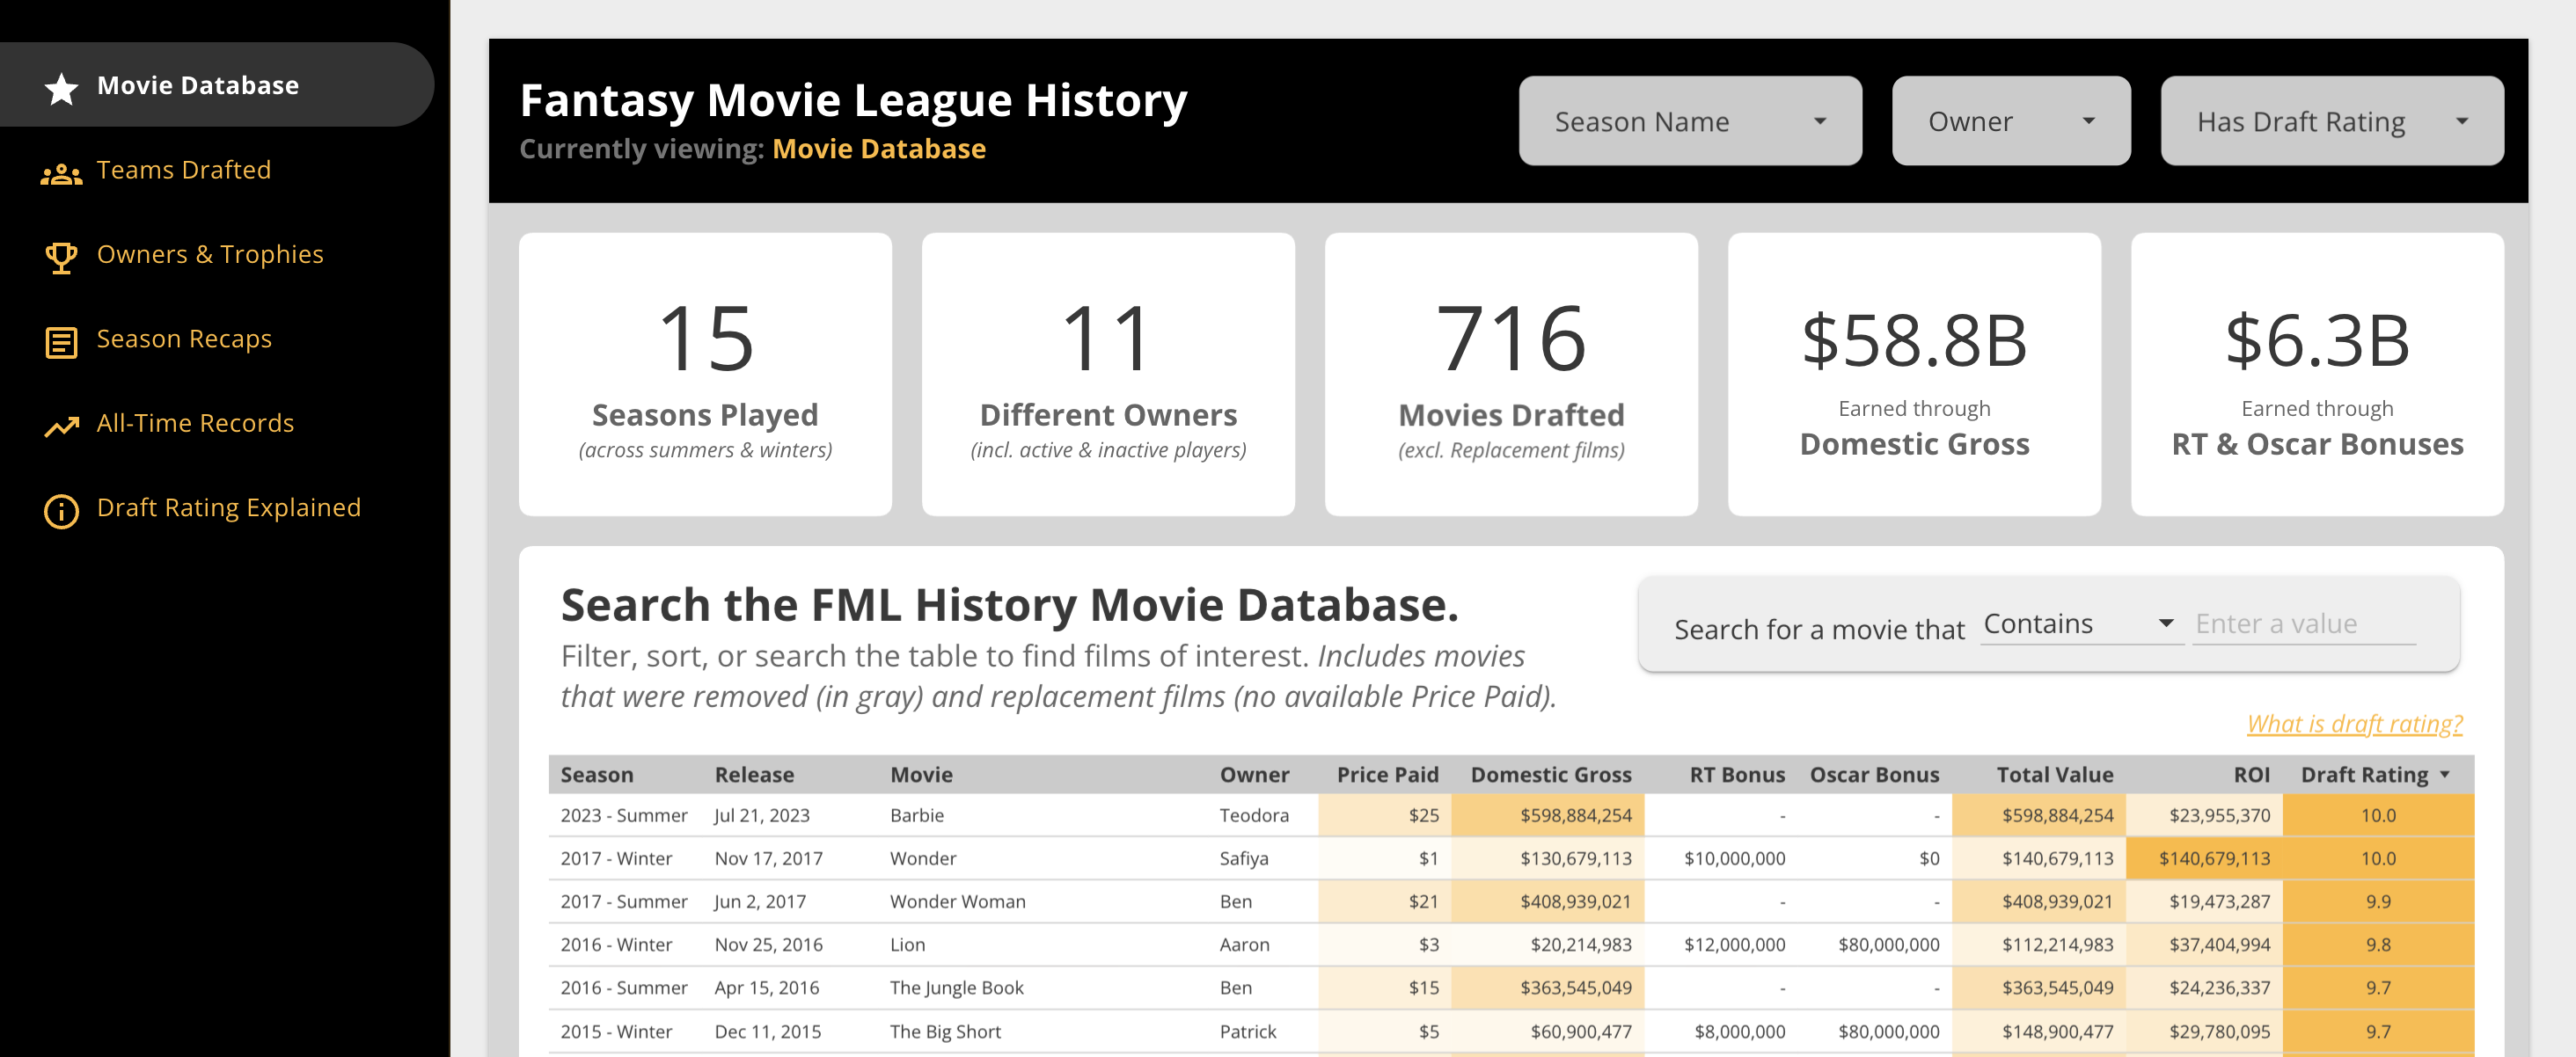
Click to explore the interactive dashboard
Context
Since 2015, I’ve played in a fantasy box office league (affectionately called FML for Fantasy Movie League) with a rotating cast of friends from my time working in the entertainment industry. Twice a year, ahead of the summer and winter movie seasons, each owner is handed a budget (usually $100) to draft a slate of upcoming films at auction. Once the season plays out, each film earns “Total Value” based on its real domestic box office gross, plus bonuses for Rotten Tomatoes freshness and Oscar nominations during the winter/awards-season slates. Whoever’s slate earns the most total value wins the season.
It’s a fun, low-stakes way to follow the box office, but a decade of drafts also produces a pretty rich dataset: which owners consistently draft well, which prices were bargains versus busts, and how the value of a pick should really be judged.
Designing the Draft Rating Metric
But how exactly should a draft choice be valued?
An obvious first instinct is to just rank picks by ROI (total value earned divided by price paid). But raw ROI breaks down fast: a $1 speculative pick that earns $10M looks identical to a $50 blockbuster pick that earns $500M, even though the second pick required a much bigger, more confident bet and would have done more to help secure a league victory. I wanted a metric that judged a pick in context relative to what a film purchased at that price should reasonably be expected to earn rather than in a vacuum.
That metric became Draft Rating, a 0–10 score built in a few layers:
- Normalized expected value. For every price point, I calculate the league’s average ROI and use it to figure out what a film purchased at that price should be worth. Actual total value minus that expectation gives a “contextual value” (did the pick beat expectations, and by how much in raw dollars?) and a “contextual ratio” (did it beat expectations, and by what percentage?).
- Blending recent form with the long run. Rather than picking one lens, Draft Rating blends both: a smaller weight on how the pick did relative to that season’s market, and a larger weight on how it did relative to all-time league history. That keeps the score from getting distorted by an unusually strong or weak season while still keeping it grounded in real, current context. Plus, it enables all-time comparisons.
- Taming outliers. Movies like Wonder — picked up for $1 in 2017 Winter before quietly turning into a $140M+ hit — are exactly the kind of pick Draft Rating should reward, but they’re also extreme enough to blow out the averages for every other film at a similar price. I use z-scores to flag picks more than 3 standard deviations from the mean and cap their influence on the league-wide normalization windows, so one outlier pick doesn’t unfairly warp everyone else’s score.
- Scaling and penalties. The final components are scaled to a 0–10 range and summed, with an extra penalty applied to films whose total value actually went negative (an actual possibility for films receiving negative Rotten Tomatoes bonuses) so a true bust can’t hide behind a merely mediocre score.
Wrangling & Visualizing the Data
Every season’s draft board lives in its own Google Sheet, filled in live during each auction and managed throughout the season by our commissioner. After each season concludes, my data pipeline is a small ELT process, entirely in R:
- Pull every season’s Google Sheet, clean up column names and prices, and stitch seasonal movie- and team-level data into one long historical dataset.
- Compute each film’s share of value from gross versus bonuses, running the contextual normalization and outlier adjustments described above, calculating Draft Rating, and rolling everything up into team, owner, and league-record summary tables.
- Those cleaned tables get written back out to an output Google Sheet, which acts as the single source of truth for reporting and feeds a Data Studio dashboard where I can explore Draft Rating, ROI, and league standings interactively without touching R again until the next season’s data needs to be pulled in.
The Best & The Worst Draft Picks
Draft Rating’s ceiling and floor have truly been battle-tested by massive outliers. Barbie ($25, 2023 Summer) and Wonder ($1, 2017 Winter) are the only two picks in league history to hit a perfect 10.0, while Shut In ($3, 2016 Winter) is the only pick to ever bottom out at a flat 0 after its total value went extremely negative.
Check out the full dashboard to explore every season, owner, and pick in league history.