NFL Pick'Em 2021 League Dashboard
Click to explore the interactive dashboard
Project Overview
Fantasy football had been a part of my life since my teenage years, but in 2021, I made the decision to step away from the game for the first season in over 15 years. While I was looking forward to refocusing my time spent on other projects, I also knew I’d miss connecting and competing with friends over the game.
One thing that made stepping away much easier to swallow: starting an NFL Pick'Em league with friends (and friends of friends) from many of my fantasy leagues over the years. Pick’Em is much simpler than fantasy football: just pick a winner for every NFL game, each week throughout the regular season. The more correct picks, the more points! In our league, we rewarded the top 2 highest scoring teams with cash every week, plus extra cash for the top 3 teams overall at the end of the season.
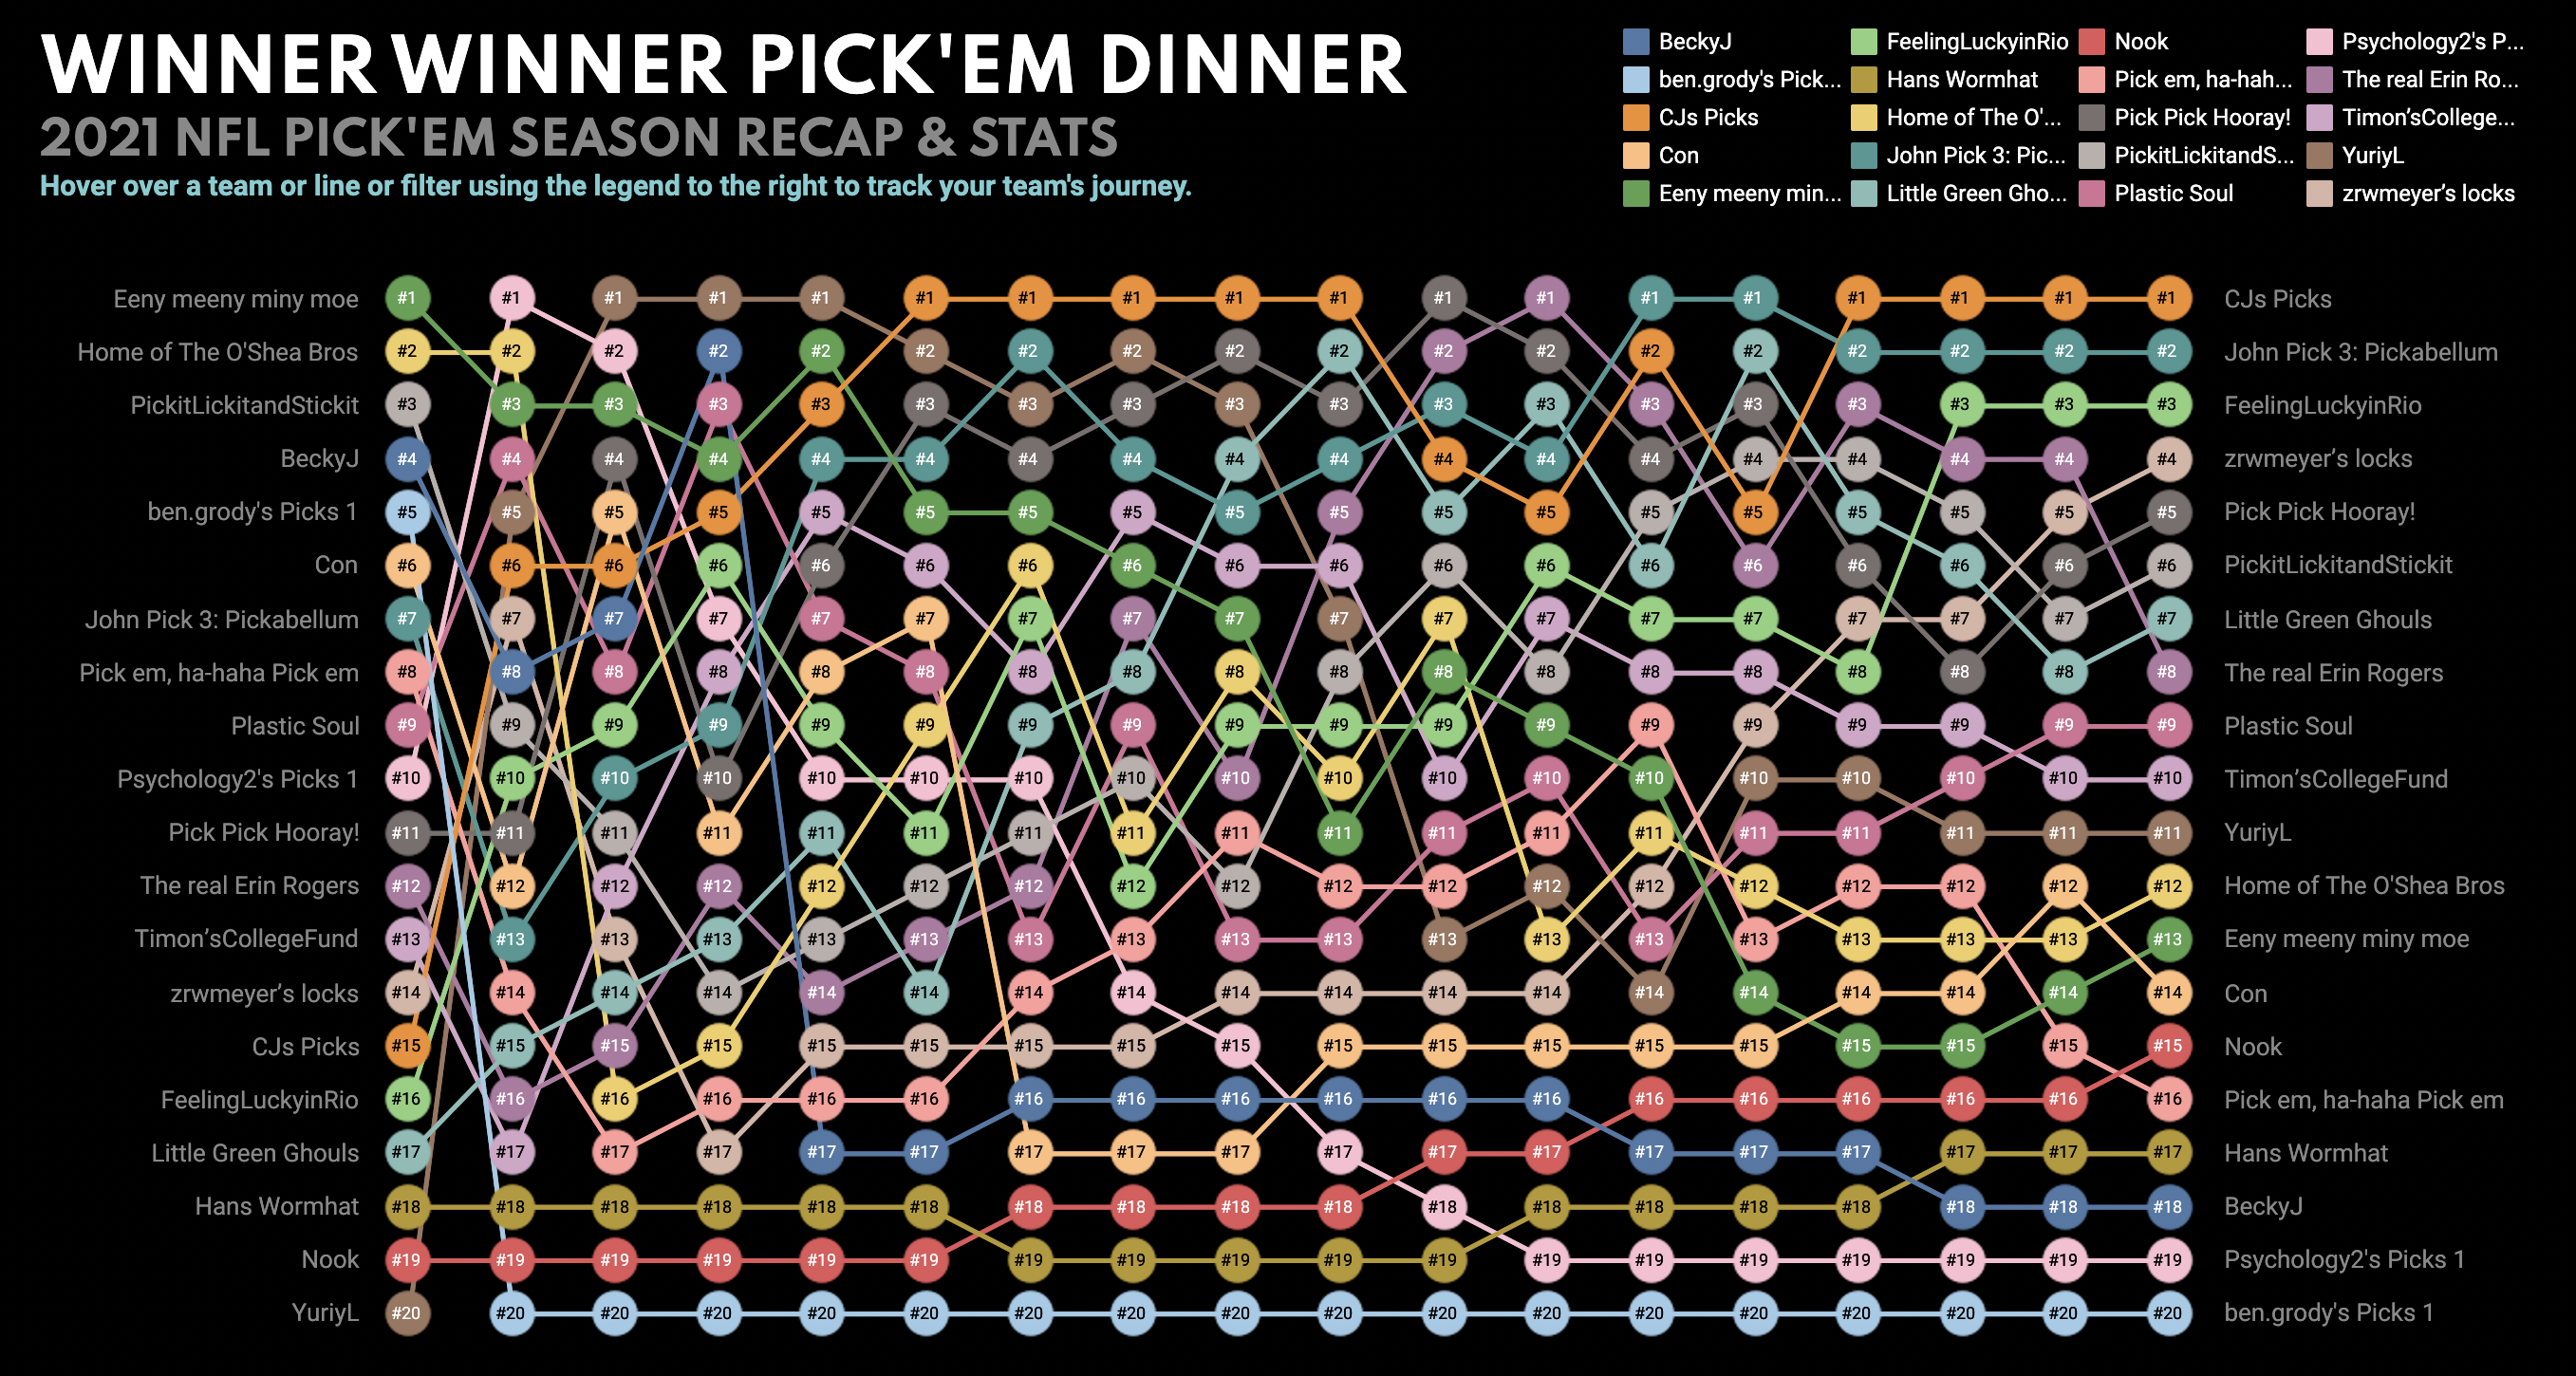
As this year’s Pick’Em season came to a close, I started getting curious about a team’s week-to-week progression. It got me thinking: what would it look like to visualize the ups and downs of the season? Which teams experienced the most extreme journeys from top to bottom and vice versa?
What resulted was an interactive dashboard to analyze and visualize team performance in my Pick’Em league. I sourced the data from ESPN’s app and my own league records managed in Airtable, cleaned and reshaped the data in R, and created a series of visualizations in Tableau.
Key Takeaways
Some of the major takeaways from this analysis:
-
Looking at our top 3 finishers, Patton and Curtis spent the vast majority of their seasons consistently in the top 6 scoring teams. Meanwhile, even though Lynn spent most the season no higher than 6th place, she finally broke through in 3rd place during the final 3 weeks of the season and held on until the end. A perfect time to peak!
-
Connor won more HP (4) than any other team. That includes one instance of 1st HP and three instances of 2nd HP.
-
Yuriy, Michael, and Jordan were the only players to win 1st HP twice. Michael’s wins all came in 2 of our final 3 weeks.
-
Almost 75% of the league won some combination of 1st and/or 2nd HP more than once. Lots of spreading the wealth around this season, which I loved to see.
-
7 teams tied the weekly top score of 140 throughout the season, while Curtis was the only player to reach that level without capturing either 1st or 2nd HP in that week.
-
Genevieve collected a ridiculous 15 POTWs (Pick of the Week) across 12 NFL weeks, including a whopping seven 1/20 differentials where she was the only player to correctly pick an outcome. With $30 earned from HP as well, it turns out that volatile picks can be fun AND profitable!
Explore The Data
It was a great season! Click here or on the image above to explore the dashboard.