Exploring Scotch Whisky, Part 1: Building the Dataset

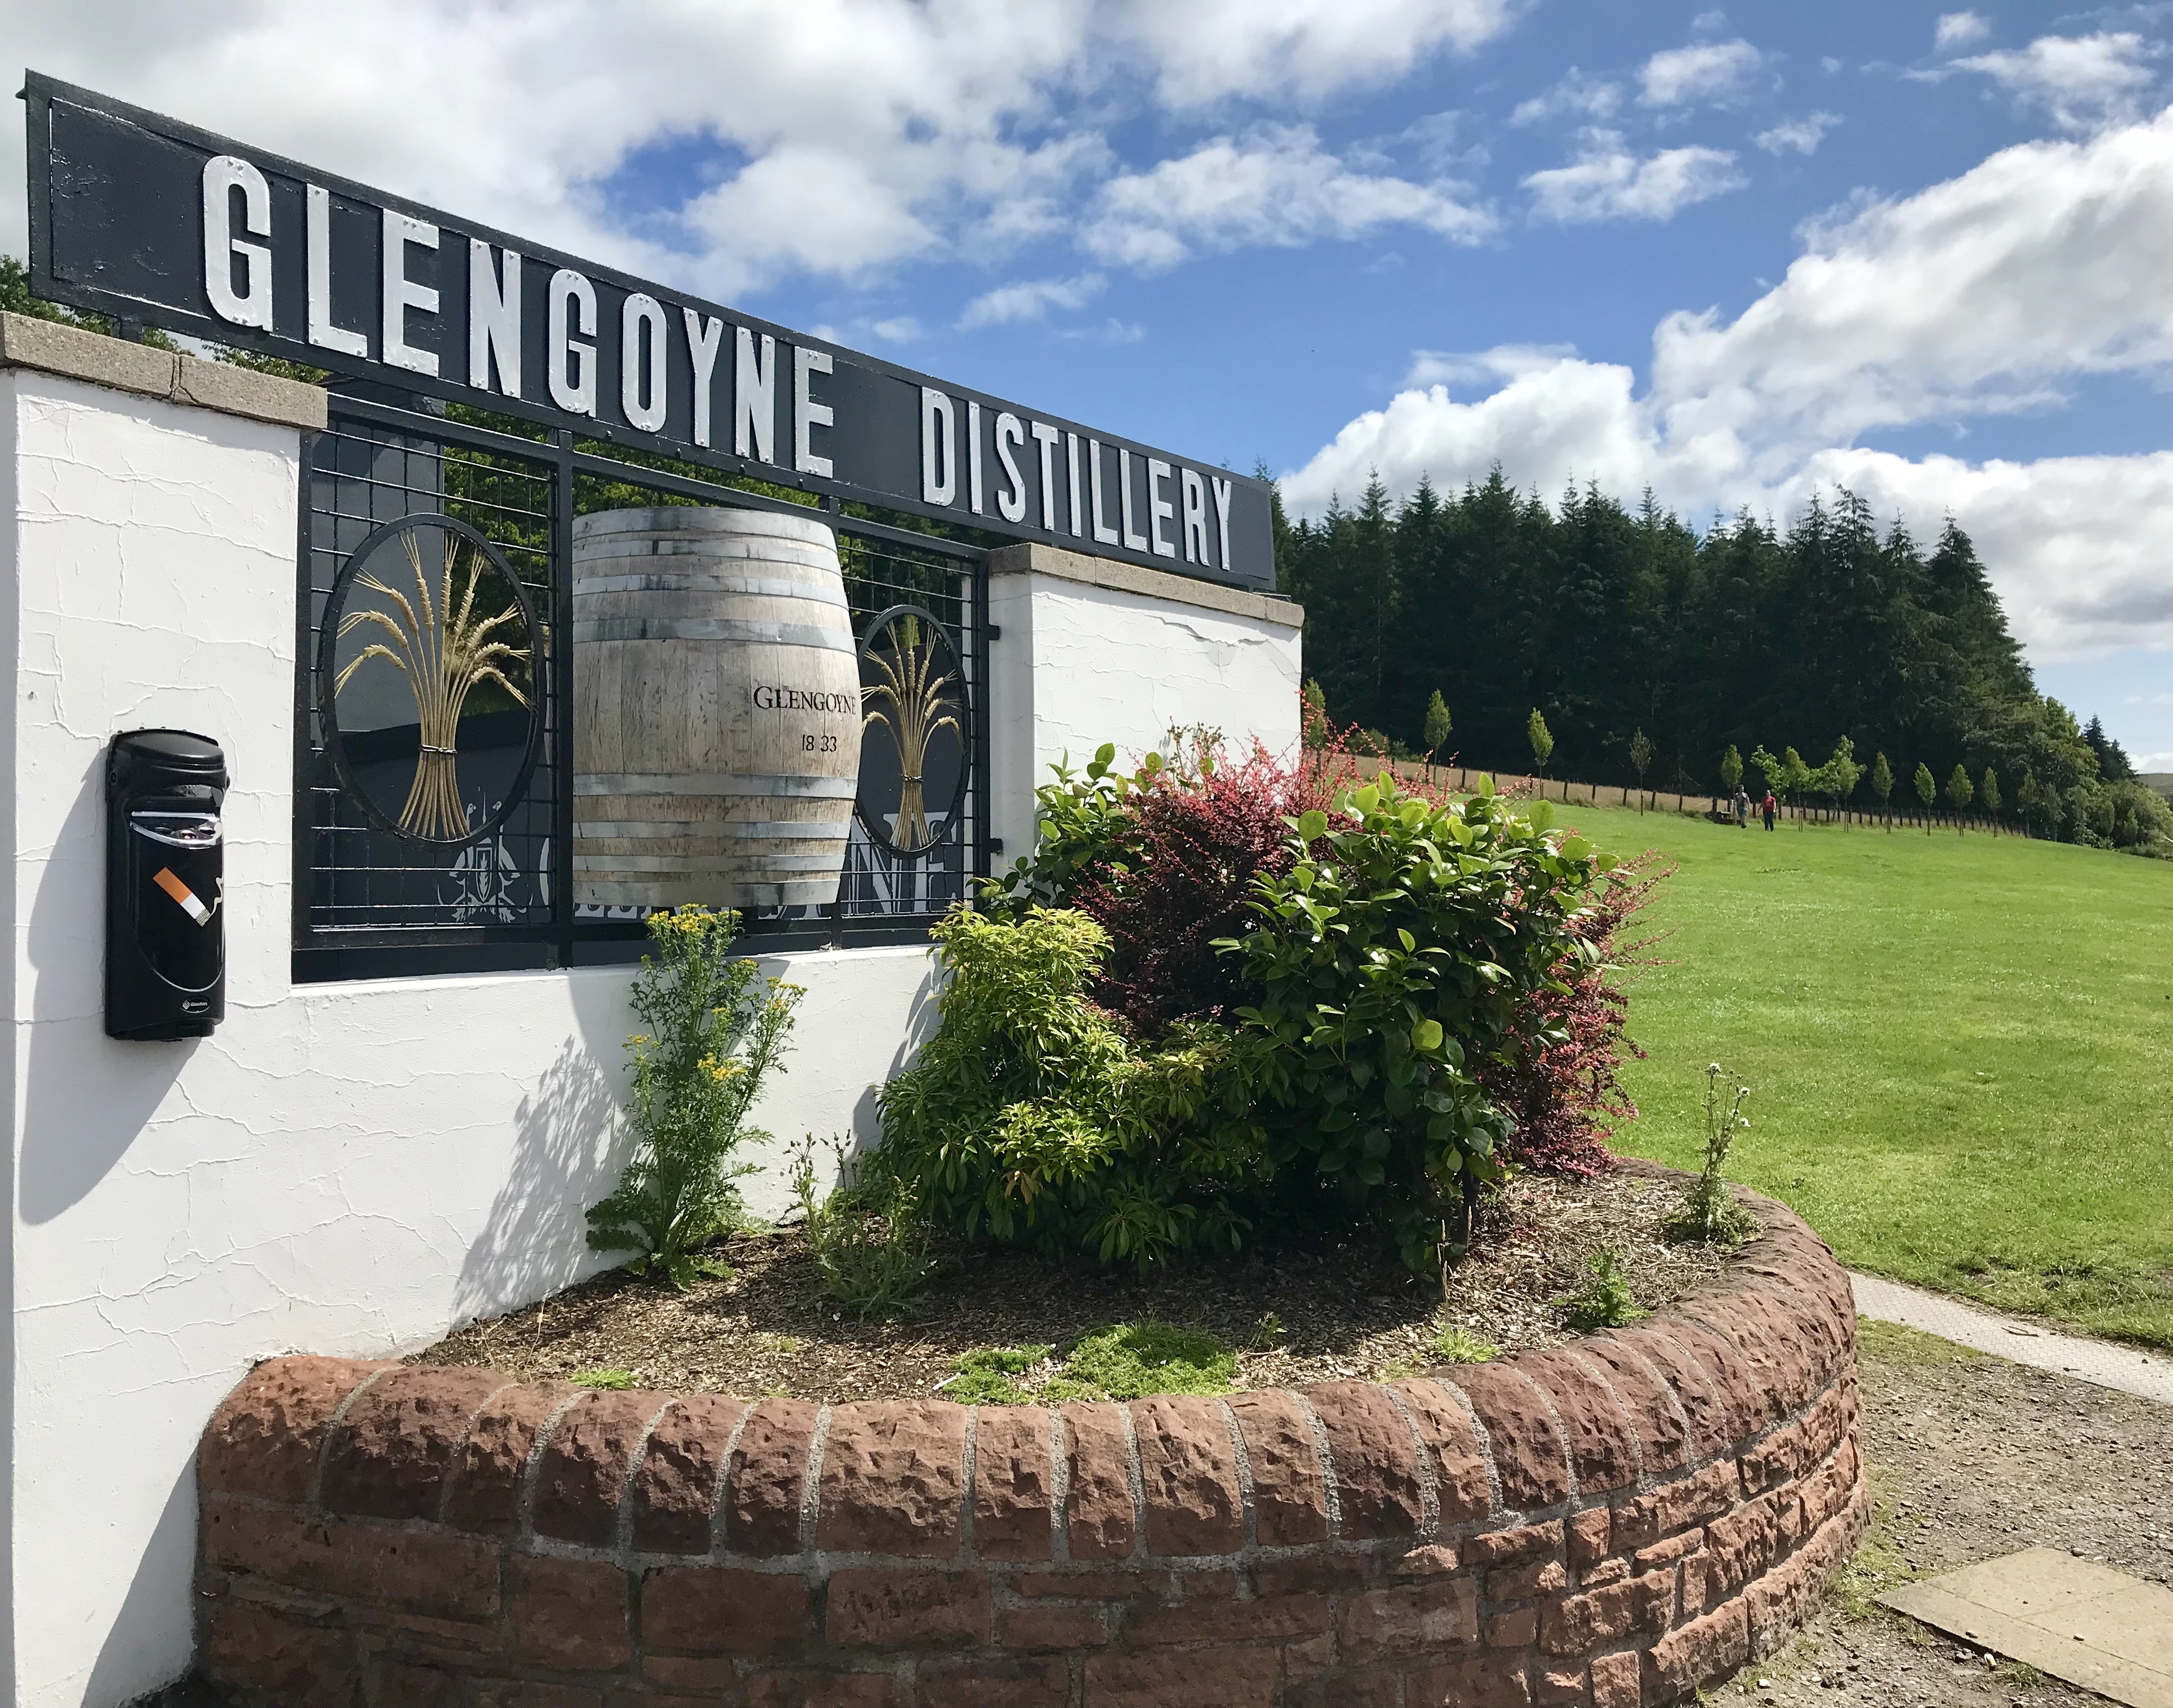
Outside of Glengoyne Distillery on our first day in Scotland.
Introduction
Nearly a decade ago, I had recently completed a cross-country move to California with lofty dreams of producing inspiring stories for film and television. I was new to Los Angeles, and everyone was a stranger – no less my new housemate whom I met through Craigslist. I had barely finished unpacking my few belongings on the first night in my new home when he beckoned me to the kitchen table, where he sat with two glasses and three different bottles of whisk(e)y.
Until that moment, I had never tasted scotch before. I had always thought that characters who sipped scotch or bourbon in movies looked cool, and I had encountered cheaper varieties of the liquor hidden in mixed drinks during college, but I had never taken the time to truly taste it before. My housemate graciously led me through samples of each spirit, sharing little nuggets about flavor notes and the additive effects of ice and water, all while we had a few laughs and got to know each other. I enjoyed the experience immeasurably, and he could tell; he generously gifted me the remainder of two different bottles we had sampled that evening. Suddenly, I had the beginnings of my very own collection of whisky.

Special honeymoon dram at Glenfiddich Distillery.
Much has changed in my life since then. Instead of living in Los Angeles with kind internet strangers, I live in Philadelphia with my lovely wife and dog. Instead of grinding through a career in the entertainment industry, I work in higher education with aspirations of transitioning to a more data-focused role. One constant that has remained, however, is a deep love for whisk(e)y, particularly scotch whisky. Nothing beats sipping on a glass of sweet, spicy scotch neat. I even convinced my wife to spend part of our honeymoon in Scotland touring distilleries and trying some of my favorite whiskies straight from the source.
Whisky is a fun casual hobby because there is much to learn and many spirits to try. That’s why I’ve begun this project to explore and deepen my understanding scotch whisky. But it can be overwhelming to choose a good bottle of whisky – and expensive to choose poorly! So why not make those guesses marginally more educated? By leveraging data, what little I already know about whisky, and new tips and fun facts I plan to discover along the way, I hope to arrive at a worthy prize for my efforts: my next bottle of scotch.
Project Goals
The overarching goals of this mutli-part project are threefold:
- To augment my learning about whisky brands, regions, flavors, and options
- To understand the breadth, depth, and quirks of the scotch whisky industry
- To leverage data to determine which whiskies I ought to try myself
Part 1: Building The Dataset
The conclusions of this project are only as useful as the data informing them. Part 1 details the process by which data were scraped, joined, reshaped, and cleaned from multiple websites for use in further analyses.
Guiding Questions
- From where can we scrape data on whisky reviews, ratings, and prices?
- From where can we find information on distilleries, brands, and regional locations?
Step 1: Finding the Data
During the COVID-19 pandemic, I read a book entitled Tasting Whisky by Lew Bryson, who happens to reside in the greater Philly area and therefore filled his book with easter eggs referencing the city I’ve grown to love. Bryson was a managing editor for the respected magazine Whisky Advocate for nearly 20 years, so I had a peek at Whisky Advocate’s website for some inspiration on where I might find scotch whisky data online. Turns out that Whisky Advocate publicizes all of its magazine contributor reviews online, which has details on thousands of scotch and other whisk(e)y releases of all varieties from across the world. Bingo!
Step 2: Whisky Ratings & Reviews
We can use rvest1 to scrape data from Whisky Advocate for all scotch reviews, including variables such price, rating points, review description, and more. This was a good chance to sharpen my regex skills; whisky names on Whisky Advocate include not only the distillery name and specific release name, but also two key variables of interest: age and ABV. It was useful to bounce between the stringi2 and stringr3 packages to extract age and ABV (where available) from each messy whisky name, as well as to clean up a few other variables.
Step 3: Distillery Names, Regions, & Locations
While scraping from Whisky Advocate, I realized that another valuable variable was hiding in plain sight within the whisky names: the distillery or brand name. However, distillery names are much less consistently presented than whisky age or ABV, which made extracting them far more difficult. I decided to scrape distillery names from another source, but most scotch distillery lists online only paid attention to single malt scotch brands and entirely ignored major blended brands such as Johnnie Walker or Dewar’s, which was a non-starter for this project. Although most of the whiskies in Whisky Advocate’s scotch category are single malt, sources indicate that blended scotches comprise a whopping 90% of all scotch sales worldwide, so it felt incomplete to ignore those brands entirely.
Like nearly everything these days, the answer was on Wikipedia. To collect the most expansive list of distillery names, I scraped data from three separate Wikipedia pages (1, 2, 3) and combined them. I was also keen on collecting data from link #1 on the regional location for each distillery. While Scotland is quite small geographically and is roughly the size of South Carolina, regional differences often translate into very unique flavor notes and aromas expressed in whisky, so I knew region would likely become an important variable to explore.
While considering regional differences, I also realized I might like to plot distilleries on a map of Scotland later in the project to better understand the spread and clustering of distilleries across the country. I found what I needed and more on whisky.com, where most distilleries have their own sub-page with tons of information. I focused on scraping distillery latitude and longitude coordinates, as well as regional names again to supplement whatever had been grabbed from Wikipedia. After cleaning the data, I had a solid list of distillery and brand names, including regional and coordinate locations for the majority of them.
Step 4: Putting It Together
To join the ratings and distilleries data together, we can implement a lovely package called fuzzyjoin,4 which includes variations on join operations in dplyr5 that allow for inexact matching on values such as regular expressions (regex), Euclidean or Manhattan distance, and much more. fuzzyjoin was perfect here because it enabled distillery matches whenever the distillery name appeared somewhere within the longer whisky name, which was fairly irregular across whisky releases.
A quirk during joining was that roughly 100 scotch releases included two different distillery names, either through a special collaboration between distilleries or because an independent bottler referenced the distillery from where their re-branded whisky originated. An example of the latter would be Gordon & MacPhail (distilled at Strathisla) 40 year old, where Gordon & MacPhail is the independent bottler (one of the largest in Scotland) and Strathisla is the original single malt distiller.
Whisky releases with two named distilleries created ~100 duplicate rows, which could bias conclusions reached about the data if included. Ultimately, I decided to create two versions of the full dataset: one that includes all duplicates for brand-level analyses, and a second without duplicates for all other analyses.
Key Takeaways
We have effectively built our dataset! Referring back to our guiding questions, we were able to gather data on whisky reviews, ratings, and prices from Whisky Advocate, while we found details on distilleries, brands, and regional locations from a combination from Wikipedia and whisky.com.
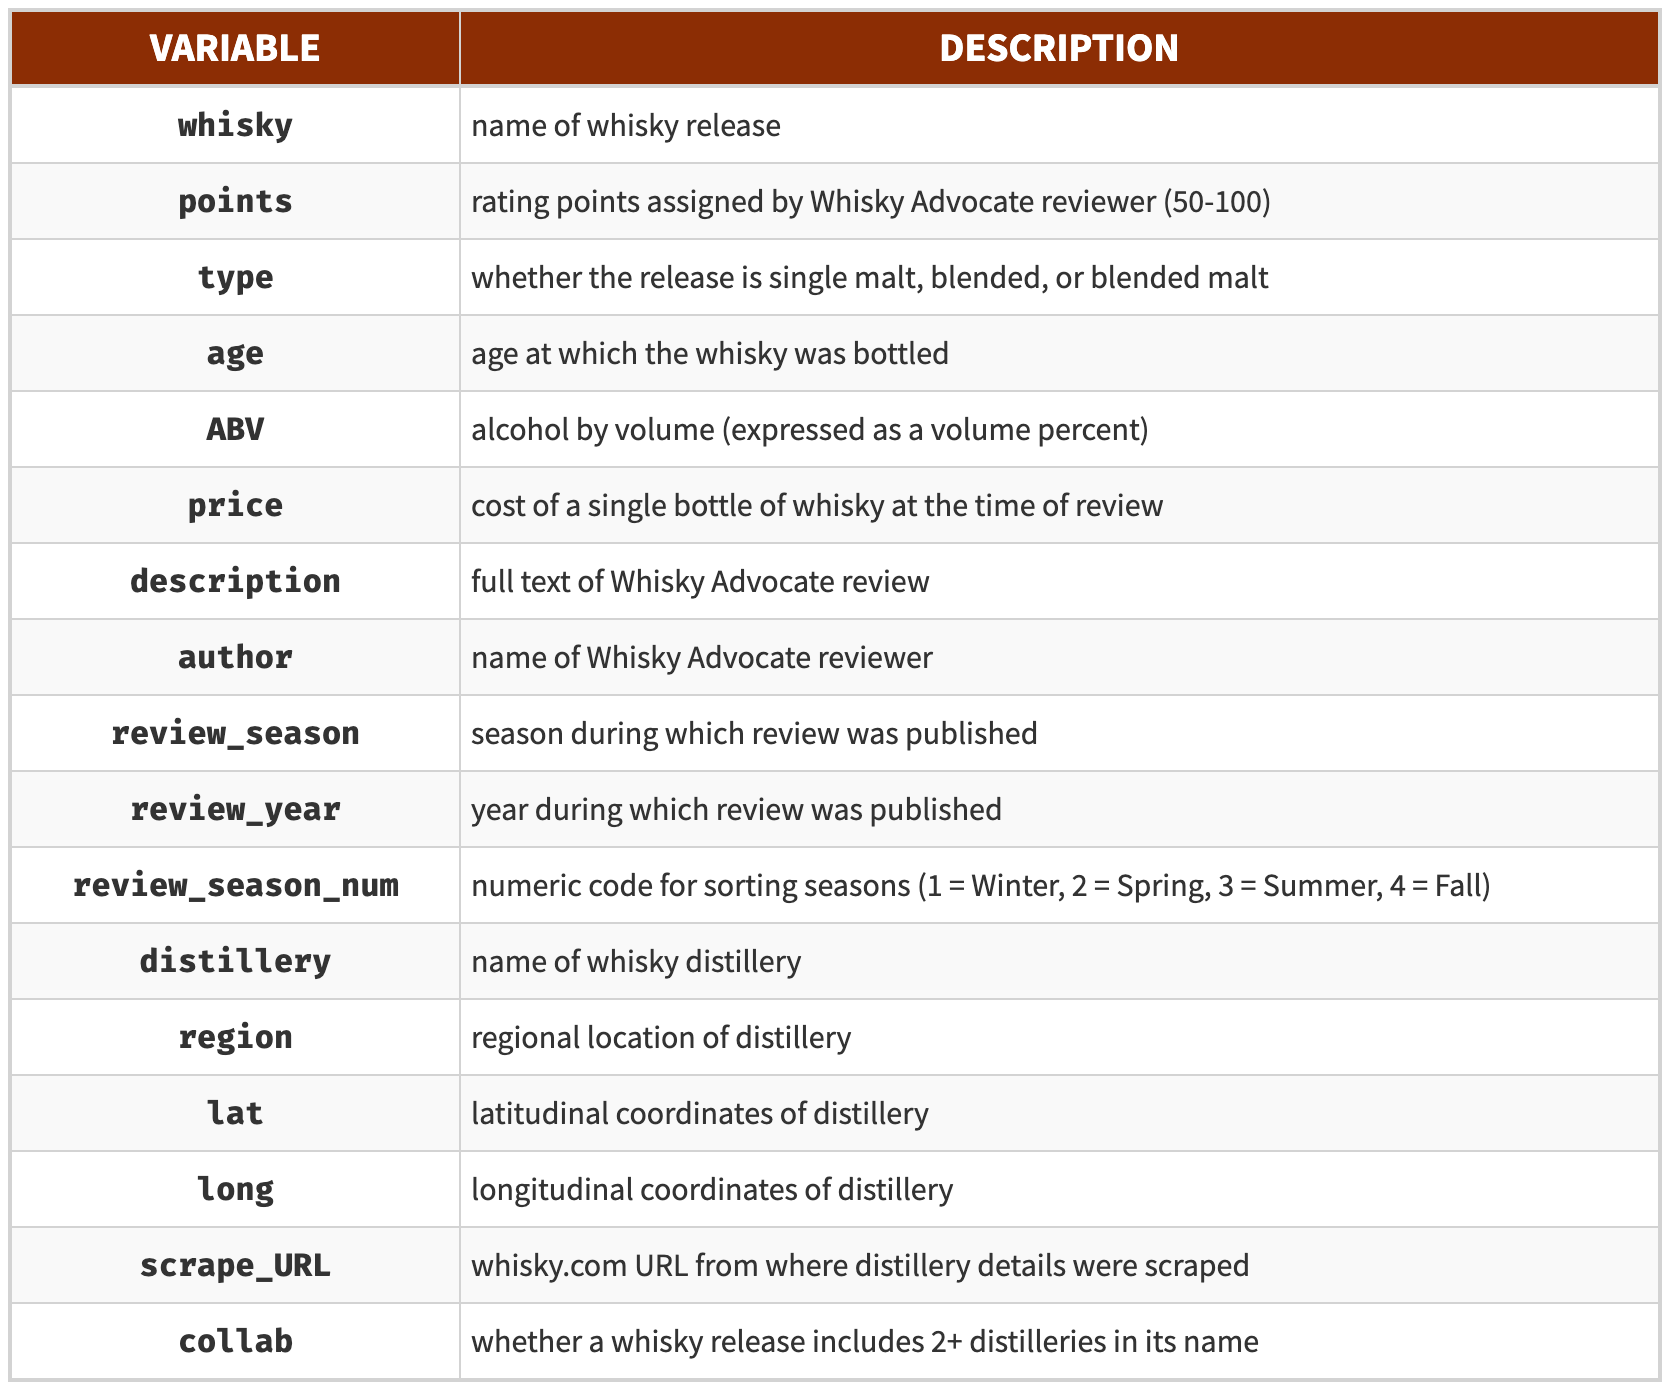
The table below lists all variables collected and created through this process that we will reference throughout the project.

Code and data for Part 1 are available on Github.
Next Steps
Now that we have our data, it’s time to dig in! Next, Part 2 covers exploratory data analysis to better understand distributions of and relationships between variables including type, age, ABV, price, and points.
-
rvest package: https://rvest.tidyverse.org/ ↩︎
-
stringi package: https://stringi.gagolewski.com/ ↩︎
-
stringr package: https://stringr.tidyverse.org/index.html ↩︎
-
fuzzyjoin package: https://github.com/dgrtwo/fuzzyjoin ↩︎
-
dplyr package: https://dplyr.tidyverse.org/index.html ↩︎